> Skip to contents (site navigation)
H/D Experiment Planner
Help
Contents
Tool description
Experiment planner allows you to create a feasible time schedule for any experiment based on collection of aliquots at different time points. It becomes especially useful when several conditions are followed. It also helps in cases where time correction has to be done – e.g. H/D performed at different pH values.
If you are using MS Tools use this citation in your papers please:Kavan, D. and Man, P. "MSTools - Web based application for visualization and presentation of HXMS data" Int. J. Mass Spectrom. 2011, 302: 53-58. http://dx.doi.org/10.1016/j.ijms.2010.07.030.
You can also include the actual link to MSTools: http://peterslab.org/MSTools/
Input fields
Conditions
Here you can set the description of your individual conditions. Field correction can be used for time correction, e.g. different pH values in H/D experiments — see references Wang L et al Protein Sci 2001 or Man P. et al J Mol Biol 2007.
Color – set the color for individual conditions in hexadecimal code – http://en.wikipedia.org/wiki/HTML_color_names. You can either choose from the colors shown below the form or you can check the following sites – http://colorschemedesigner.com/, http://www.w3schools.com/Html/html_colors.asp, http://www.keller.com/rgb.html. The best results are achieved with dark colours.
There is a testing area for testing your hex codes and colors.
Times
Type the times selected for collection of aliquots here. Place one time point per line and use either single letter (s, m, h) or three letter (sec, min, hrs) coding for seconds, minutes and hours, respectively. Any number without units will be considered as seconds. The same applies to strings containing non-number character. Therefore use only whole numbers (e.g . “1.5h” will be considered as “1.” and turned into one second). If you want to include 1.5hrs recalculate it into minutes or seconds (90min or 5400sec). See an example here.
Minimal pause between events
Means the shortest time you need for collection of one aliquot (10s reasonable, 30s very easy).
Minimal pause between mixes
Time required to start/mix the reaction = beginning of the experiment.
Time to start (HH:MM format)
Enter real time at which you want to start the experiment.
Show time conversions
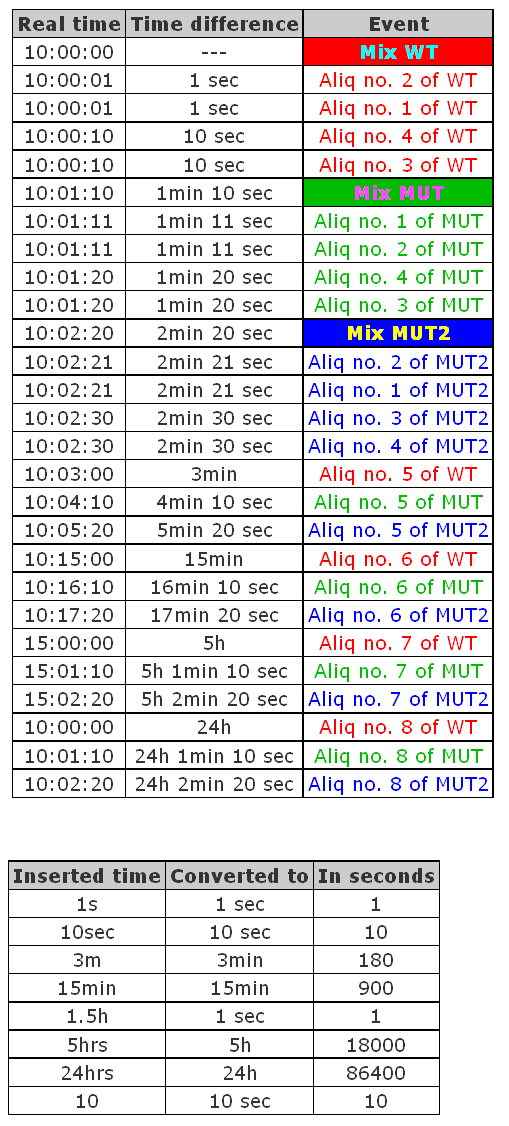
This will create second table showing how the entered strings/values were interpreted. First column shows entered values, second column shows how those values were interpreted and the third one shows their equivalent in seconds. This table is placed bellow the main table with timing of the experiment.
Number of results columns
If you want to copy-paste the resulting table into some word processor and have it suitable for printing, play with the number of the output columns so that the result fits to entire (or smaller number of pages) page of the print-out.
Testing area
Color to test – set the hex code of your selected color here and press Test. You will see if the value entered is correct and to which color it corresponds.
This field does not influence the result but serves just for search of user-defined colors. You can also choose one of the predefined colors by clicking on the respective colored area.
Results
The result is represented by a simple table showing the times for mixing of the reaction and collection of aliquots. The conditions are differentiated based on the color set in the input field. For the convenience of the user second table showing calculation of the times entered in the input form is shown bellow (if the Show time conversions is selected). First column shows entered values, second column shows how those values were interpreted and the third one shows their equivalent in seconds.
You can see the result example.
