> Skip to contents (site navigation)
Draw H/D Heat Map
Help
Contents
- Contents
- Tool description
- Input Fields
Tool description
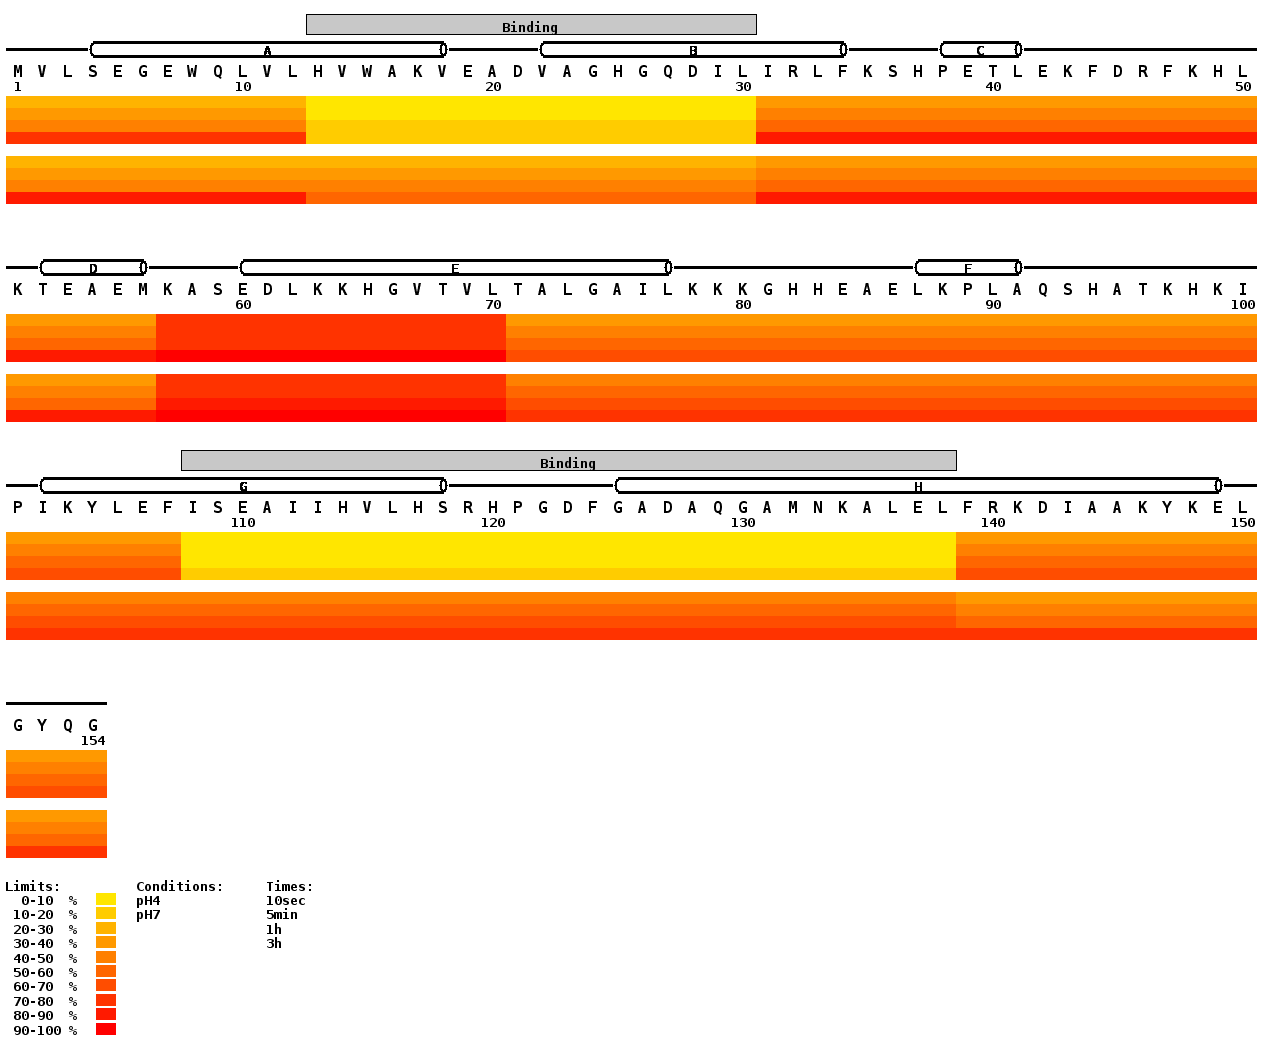
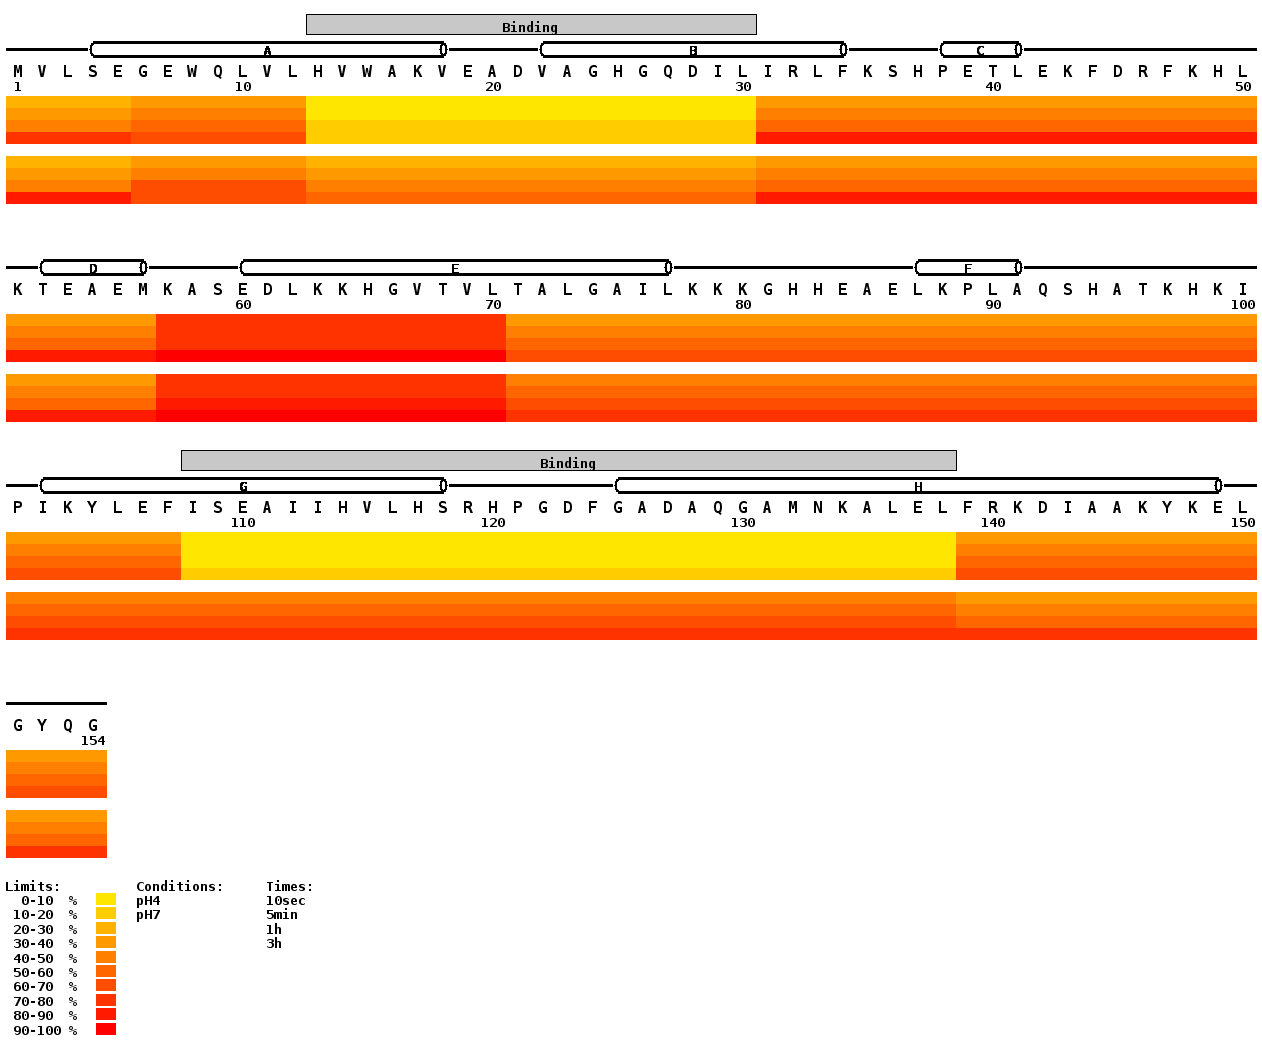
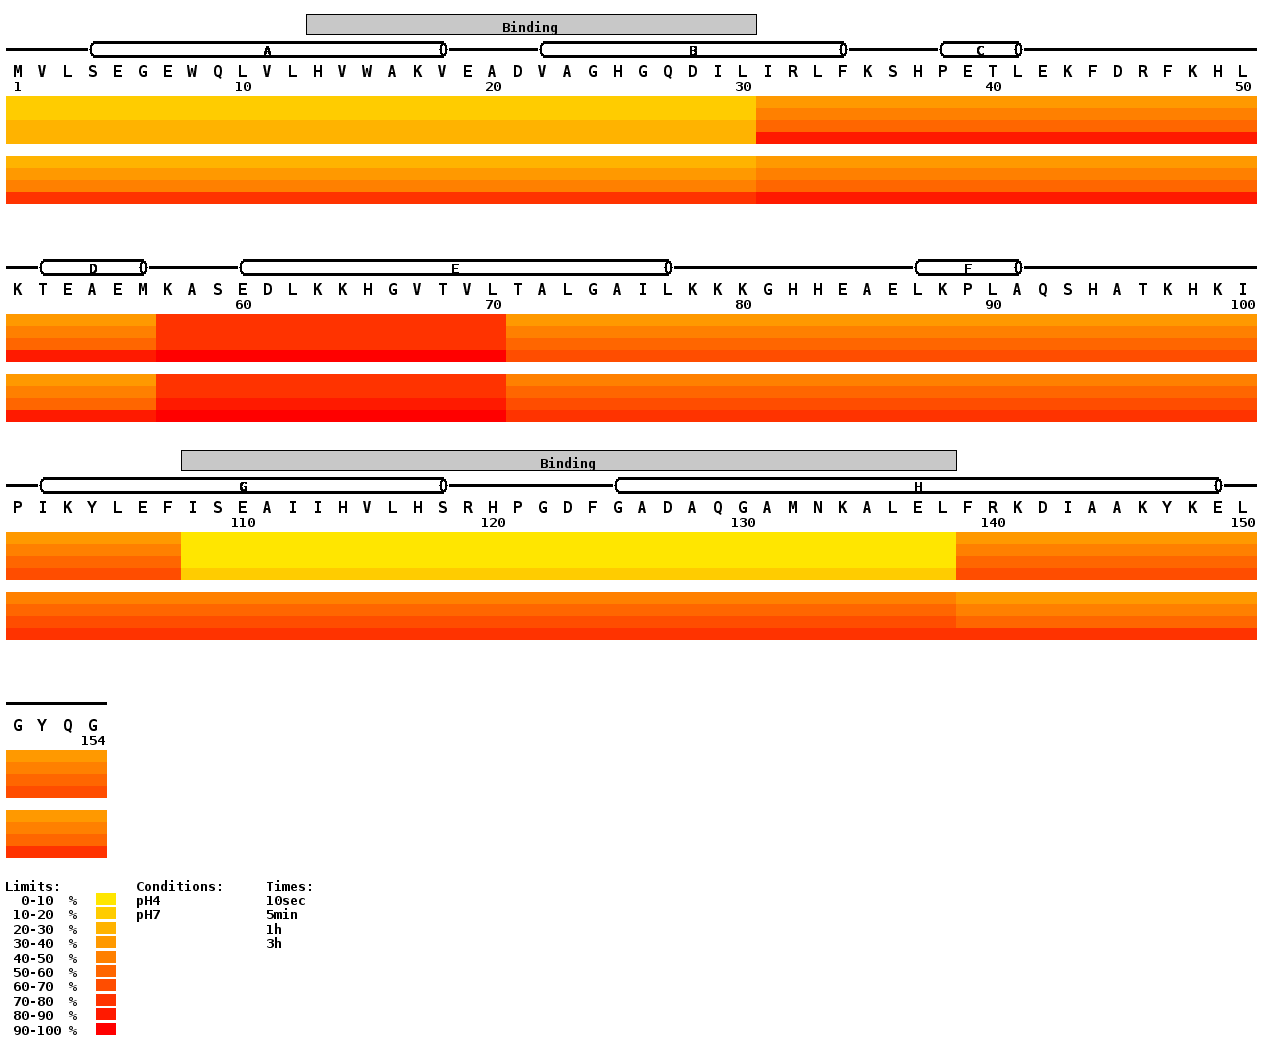
Draw H/D Heat Map is a tool for visualization of DXMS results in widely used heat map (color gradient) representation. It allows you to display the evolution of deuteration of individual parts of the protein and at the same time it also enables comparison of different conditions. It requires protein sequence, file with the peptides and their percentage of deuteration. Optionally you can use also the Structure file which allows you to visualize structural elements (alpha-helix, beta-sheet) and domains above the peptide sequence in the resulting image.
If you are using MS Tools use this citation in your papers please:Kavan, D. and Man, P. "MSTools - Web based application for visualization and presentation of HXMS data" Int. J. Mass Spectrom. 2011, 302: 53-58. http://dx.doi.org/10.1016/j.ijms.2010.07.030.
You can also include the actual link to MSTools: http://peterslab.org/MSTools/
Input fields
Sequence file
This file contains protein sequence in one letter code. Line breaks as well as lines beginning with > are ignored so you can use your FASTA formatted sequence files. No check for validity of the characters is done so it is possible to use your own symbols, not only the 20 standard amino acid symbols. You can download an example sequence file.
Digest file
This text file contains information about peptides and their deuteration (expressed in %) at different times and under various conditions. The format of this file is slightly more complicated, all columns have to be separated by tab. First line must contain the headers (first three columns) From, To and Time. All times must be converted to seconds. Next columns are reserved for individual conditions and their description is placed on the first line. The lines bellow header are reserved for the actual data, each line must contain peptide limits, time and percentage of deuteration at the respective time point Lines that not containing appropriate number of columns (and numbers in them) are ignored, so you can leave empty lines between peptides or insert some comment line.
Specific case is represented by overlapping peptides. There are two ways how to handle the overlaps. One is to make subtraction for peptides having one common end (e.g. 1-30 and 1-12). This version of script is not capable of doing that however we plan to implement it in the future version. The other is not doing any calculation so therefore it is advisable to prepare the data in the Digest file in the way providing the best possible result. That means selecting shortest peptides covering the entire protein sequence (in order to reach highest possible resolution) and avoid overlaps. If non-overlapping peptides can’t be found assemble the order of the overlapping ones in following manner – place first the longest peptide and after that place the shorter one and so on. The script will first draw the heat map for the first peptide then place the second heat map over the first one and the third one over the first and second one. E.g. peptides 1-30, 1-12, 6-10 are best placed in the order (from top to bottom) as written here. If you swap the order, the 1-30 will cover the preceding two ones and heat map will cover entire continuous string 1-30. It is noteworthy that this strategy does not have any problems with overlapping peptides not having one common end.
Examples of digest files and their results can be downloaded/viewed here – non-overlapping (result), overlapping correct order (result), overlapping wrong order (result).
Structure file
This text file is optional. You can use it if you wish to draw the structural elements (alpha-helix or beta-sheet) and domains above the sequence. It has five columns:
- The first column contains either Str or Dom keyword. It tells whether the line encodes information about secondary structure or domain.
- The second column contains the description of the structural element or domain (e.g. HelixA, Sheet1 or LipidBinding, etc.) There must be at least one character and the description should not contain spaces. Try to abbreviate the description of your structural elements because it is not fitted inside shapes (no readjustment of the font size) but placed above it. Therefore the long strings will overlap.
- The third column encodes which type of structural element will be drawn – a stands for
alpha-helix (cylinder) and b stands for beta-sheet (arrow).
If there is the Dom keyword in the first column, this field is left empty. - The fourth and fifth column contain the first and the last residue number of described region respectively.
If the formatting of the line is not correct, warning message is written above the resulting image. You can download an example structure file.
Font
You can choose any TrueType font available on the server in this combo box. You can achieve the best results using condensed and narrow fonts.
Font size
Enter the desired font size in pt in this field. The lower limit is 6pt.
Number of AA's per line
This is the number of amino acids on one line. For example if you have 120 AA long protein and set 50 in this field, the result contains two lines with 50 amino acids each and the last line with 20 amino acids.
If you enter number bellow 10 or a non-number entry, the default value of 50 will be used.
Thickness of bands
The thickness of the peptide representing bands in pixels. If you enter number lesser than 2 or a non-number entry, the default value of 2 will be used.
Width of one AA position
Here you can choose from the list narrow, wide and normal. Narrow means that there will be only little space on both sides of AA letter, however the seqence will look compact. Another aspect of having narrow chosen in this filed is that there will not be enough space for numbering of residues, thus this option is suitable only for shorter sequences or in combination with higher value of Numbering step input field.
On the other hand, choosing wide here gives you much more space for numbering or for example for latter hand-written notes to your picture.
User defined colors
Check this option if you wish to use specific colors for 0% and 100% exchange. Other colors will be calculated according to the value in Color steps field. If unchecked, the default rainbow palette will be used.
Start color
Only used if User defined colors field is checked. The selected color will be used for 0% exchange.
End color
Only used if User defined colors field is checked. The selected color will be used for 100% exchange.
Color steps
Only used if User defined colors field is checked. The interval 0%-100% will be divided into as many staps as this field says.
Added N-term AA's / Start real numbering with / Added C-term AA's
These options are especially useful in case of recombinant proteins bearing tags or for constructs representing just a part of the native protein. It allows you to keep the native sequence numbering. If you have native protein or do not follow native sequence numbering leave the default values here (0, 1, 0 respectively). In other cases specify the number of amino acids added to the N- (Added N-term AA's) and C-terminus (Added C-term AA's) of the protein and define (Start real numbering with) from which amino acid in the native protein your construct starts. E.g. consider protein having 648 residues, your construct corresponds just to one domain (310-435) but has HisTag at the N-terminus (+12 residues) and three additional amino acids at the C-terminus. Then you will set Added N-term AA's to 12, Start real numbering with to 310 and Added C-term AA's to 3. In the resulting figure you will see the residues from HisTag numbered from -12 to -1, C-terminal addition as +1 to 3+ and the numbering will start from 310 and end with 435.
Numbering step
Defines numbering of residues. By default the numbering occurs above each residue (numbering step 1) but it is often useful (for clarity of the resulting image) to use bigger numbering step, e.g. 10, 20 or 50.
Tips and examples
After the resulting image is created, it is displayed in your browser. If it is too large for your display, it is shortened. The easiest way to get the image is by right-clicking it and choosing Save image as... (or similar) from the context menu.
Another way to get the result is to click on "input file and result in tar bz2 file" link above the image and download the tar bz2 archive (could be unpacked using GNU Tar or 7-Zip) containing your input files together with the resulting image.
Dimensions in pixels (and roughly in milimeters at 300dpi) is displayed above the image. 300dpi is the resolution suitable for standard printing. If you need the image to be more narrow/wide, the Font, Font size, Number of AA's per line and Width of one AA position options should be adjusted.
You can see the example result.
